November 18, 2018
by Dafyd Martindale
A report released by the Australian Conservation Foundation (ACF) has rated Nanango as the fifth most polluted postcode in Queensland … but is this really fair or accurate?
In ‘The Dirty Truth’, the ACF took data from the from the Department of Environment and Energy’s National Pollutant Inventory (NPI) and matched it against income data collected by the Australian Bureau Of Statistics (ABS).
The NPI collects data from big polluters such as power stations, mines, quarries, feedlots, poultry farms and factories that self-report calculations about what they’re putting into the atmosphere.
It monitors 93 substances which have been identified as important because of their possible health and environmental effects.
The ACF then matched the NPI’s data with postcodes and ABS information to produce a national pollution map, the first time this has been done.
However, all is not quite as it seems … or so we found when we drilled down into the data.
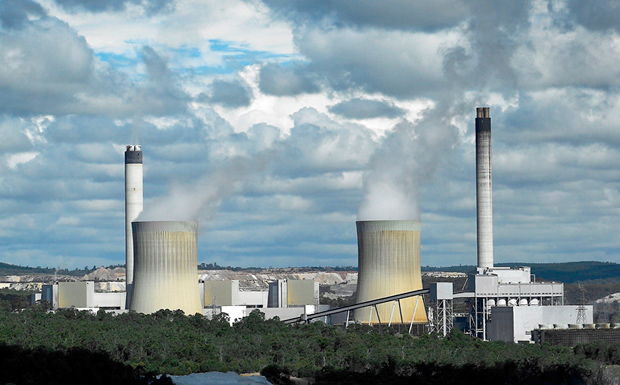
For example, the NPI reports the bulk of Nanango’s estimated pollution comes from the Tarong Power Stations and Meandu Mine, which are located roughly 20km from Nanango.
Yarraman is about the same distance from the power stations and the mine, but its own postcode pollution rating is zero.
This discrepancy suggests that while the power stations and mine are sources of pollution, it is unfair to label Nanango as the sole recipient of this.
And, as the pollution from the power stations would be mostly via its chimney stacks into the atmosphere, where it eventually ends up would depend on multiple factors, including the weather.
The same also applies to Blackbutt, which is rated as Queensland’s 29th most polluted postcode because it produces an estimated 2.1 million kilograms of emissions per year.
But a closer look shows most of this has been blamed on poultry farms near Colinton at the foot of the Blackbutt Range (which shares the same postcode).
These emissions are highly unlikely to affect Timbertowns’ residents.
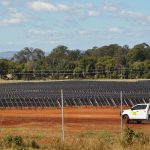
In the rest of the region, only Kingaroy (Swickers) and Murgon (Teys) are rated as polluted postcodes.
The remainder of the South Burnett’s postcodes are rated as pollution-free, even though most have feedlots, quarries or smaller factories that generate NPI data.
The ACF’s key discovery was that nationwide, the lower a postcode’s average weekly household income the more likely it was to be home to polluters such as factories, refineries, mines and power stations.
It found that the wealthiest 20 per cent of postcodes have almost no polluters, while the poorest have the most.
In regional areas, the biggest polluters are coal-fired power plants and mines.
In urban areas the biggest polluters were likely to be factories located in (or at the edge of) urban areas because that’s where they draw their workforce.
The Dirty Truth report, which is based on data from 2016-17, ranked Mt Isa as Queensland’s dirtiest postcode, discharging an estimated 207 million kilograms of pollutants into the atmosphere every year thanks to Glencore’s Mt Isa Mines.
This was followed by Gladstone (97 million kg), Moranbah (76 million kg), Gracemere (69 million kg) and Nanango (61 million kg).
The report ignored air pollution emitted from cars and other sources not monitored by the NPI, but acknowledged Australians living in urban areas were exposed to much higher average levels of air pollution from these sources than those living in regional and rural Australia.
External links: