
July 19, 2021
by Dafyd Martindale
How much have the South Burnett Regional Council’s rates increased during the past three years? And how do we compare with our immediate neighbours?
Now that the South Burnett and all neighbouring Councils have handed down their 2021-22 Budgets, we decided to put those two questions to the test.
What we discovered – perhaps to the surprise of all those who think any rate rise is too much – was this:
Over the past three years the South Burnett has had the lowest average total rate rise of any of our neighbours.
Though we should qualify that by emphasising this good news does not apply to our region’s rural property owners, nearly all of whom experienced steep rises in their rates during the same time period.
This was because the last round of property valuations in 2019 raised the average value of farmland by nearly 30 per cent, which pushed rural rates up significantly for the past three years.
But town dwellers – who comprise the majority of our population and collectively contribute the most rate revenue – experienced little change in their own valuations.
The table below lists the average rate rises imposed by the South Burnett and our five immediate neighbours over the past three years.
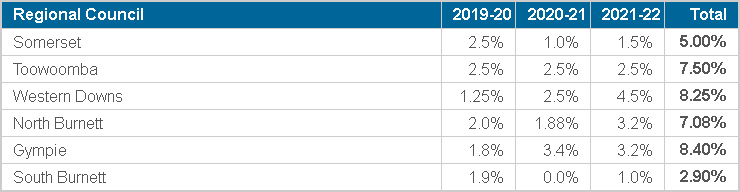
According to this list, Gympie (8.4 per cent) had the biggest overall increase, followed by Western Downs (8.25 per cent), Toowoomba (7.5 per cent) and the North Burnett (7.08 per cent).
Tellingly, two of these four Councils – Gympie and the North Burnett – have reported they are facing financial difficulties and now trying to secure a path back to sustainability.
At the other end of the pack, Somerset – which was once regarded as one of the least expensive places in Queensland to pay rates – has had a 5 per cent increase over the past three years.
And the South Burnett?
Well, outside our farmlands, most residents have seen a fairly modest rate rise of 2.9 per cent since 2019.
Of course, rates aren’t everything and there have also been increases in service charges for things such as water, sewerage, waste collection and levies as well.
These types of service charges apply to all six Councils in our study, and the out-of-pocket cost per household can vary for some charges depending on use (eg. water consumption).
But here in the South Burnett these rises have also been kept reasonably small.
Service charges rose an average $108 per annum in 2019-20, $44 per annum in 2020-21 and $52 per annum this year.
This adds up to a total rise of $204 per annum (ie. about $4 a week) over the past three years.


Thank you for your research. There are some people who continually pedal false information.
A false headline. The article is about rate rises yet your headline just mentions rates.
I don’t expect that this comment will be published as it’s unfavourable to you and the council, regardless of how true it is.
Does the general public know how much you are supported financially by the council?
Our actual rates, as opposed to the percentage increases you mention, are exorbitant when compared to other council areas in Queensland.
I’d love to see an article about that from you.
We are supported by advertising. The South Burnett Regional Council is just one of our advertisers. You should not believe what you read about us on social media. It is not only defamatory, it is wrong.
We have previously published news stories comparing our actual rates with similar size councils, and will do so again in the future.
You can find links to these previous reports here:
https://southburnett.com.au/news2/2018/11/12/rural-rates-how-we-compare/
https://southburnett.com.au/news2/2018/11/07/rates-how-do-we-compare-now/
– Anne Miller, Editor
The truth is out there, as is the total rubbish!
One thing that has always stood out is the unbiased and no nonsense reporting from Southburnett.com.au
Thank you for keeping us informed and making a positive contribution to our community.