
November 12, 2018
by Dafyd Martindale
Last week southburnett.com.au published our fifth annual residential rates comparison, and since we did this several readers have asked if we could do a comparison of rural rates as well.
We haven’t done a rural rates comparison in the past for two reasons:
- Residential properties make up the overwhelming majority of rateable properties in our region, and in all the other regions we compare
- There is a much wider variation in rural rating schemes than there is among residential properties, with some regions setting their rural rates based on what type of agricultural use a property is put to or where it’s located, while others have a flat rate that ignores these things.
This variation makes comparing rural rates more difficult than comparing residential rates, although not impossible.
However, because of this variability we have included lower and upper ranges for some of our neighbours in our chart (below).
As with our residential rates comparison, we have used State-wide rates data from the Department of Local Government for this study, which covers rates charged in the past financial year (ie 2017-18).
For the sake of simplicity, we have only compared the South Burnett with our five immediate neighbours, who face similar issues to the South Burnett.
While this study does NOT reflect this year’s rural rate rises in the South Burnett – we will need to wait another six to nine months before that data is available – it shows what the South Burnett’s position was relative to our immediate neighbours last financial year.
* * *
How Our Rural Rates Compare With Our Neighbours
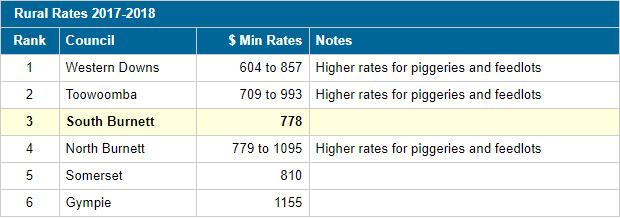
What we found when we compared the South Burnett’s rural rates to our neighbours was that we were neither the cheapest nor the most expensive place to own a rural property.
The honour for the least expensive place to farm was Western Downs, where the reported minimum general rate ranges from $604 (for a small rural property not in a town area) to $857 (for a small rural property near Dalby or Chinchilla).
This is followed by Toowoomba, which charges $709 for a low-intensity rural property, rising to $993 for a city rural property.
The South Burnett follows in third place, with a $778 minimum charge for a rural property, regardless of its use or location.
The North Burnett is close behind, charging anything from $779 for a small rural property of less than 100ha up to $1095 for rural orchards.
Somerset, which levies $809.80 for farmland valued at between $45,000 and $4 million, came in fifth place.
Finally, Gympie appears to be the highest, charging a minimum of $1155 for rural properties.
* * *
But My Rates Are Higher!
Rural property owners will likely find their actual rates are higher than the figures above.
There are three reasons for this:
- As we noted earlier, the data we used for this survey is for the past financial year (ie 2017-18), which is the most recent official data available.
- The figures reported to the Department of Local Government by councils are MINIMUM base rates.
- This year, the South Burnett Regional Council folded the Road Levy into the general rate, which means it is now tied to the rate-in-the-dollar for all classes of properties (rural, residential, industrial etc) rather than being a flat $200 annual charge. This change has led to some rural properties seeing increases of 17 per cent (or higher) in their 2018-19 rates bill.
The purpose of this comparison is simply to show where the South Burnett sat relative to our neighbours in terms of rural rates until June 30 this year.
We will need to wait until 2018-19 comparative data is available to see what effect this change to the Road Levy has really had on South Burnett farms relative to our immediate neighbours.
Some readers will argue that comparing last financial year’s rates is of no use because of the steep increase they’ve seen this year, and we accept that.
However, if we’re going to calculate rural rates as well as residential rates into the future, we can only say that comparisons have to start somewhere and this is the most recent starting point we can access.
* * *
What About The Rate In The Dollar?
Some readers have also queried what each council’s rate-in-the dollar is.
Anyone interested in this should download the LG Information file we link to at the end of this article because in addition to minimum rates, this file also lists each Council’s rate-in-the- dollar for particular categories of rural properties.
Readers can then use this information to compute what rates they would likely have paid on their rural property in 2017-18 if they had chosen to live in any neighbouring region – based on their property’s unimproved capital value – and compare it to what they paid the SBRC that same year.
- External link: LG Information – 2017-18 general rate and 2016-17 general rate (231kb Excel spreadsheet)
Related articles:
- Rates: How Do We Compare Now? (2017-18 comparison)
- Rates: How Do We Shape Up In 2017? (2016-17 comparison)
- Rates: How Do We Compare In 2016? (2015-16 comparison)
- Rates: How Do We Compare This Year? (2014-15 comparison)
- Rates: How Do We Compare? (2013-14 comparison)


I don’t think that there is any point in comparing the lowest rates, maybe compare how your rates would be worked out in other councils across the state. Some comparison “Rate on the dollar” figures for other councils in Queensland show the SBRC is by far the highest rate.
Rate in the Dollar yearly:
SBRC 1.3376
Lockyer Valley 1.1221
Gympie 1.05884
North Burnett 0.997
Banana Shire 0.926
Gundi 0.9
Somerset 0.8705
Toowoomba 0.7014
Taroom Shire 0.692
Western Downs 0.678
Fraser coast 0.6735
Maranoa 0.6070566
Morton Bay 0.4228