November 15, 2017
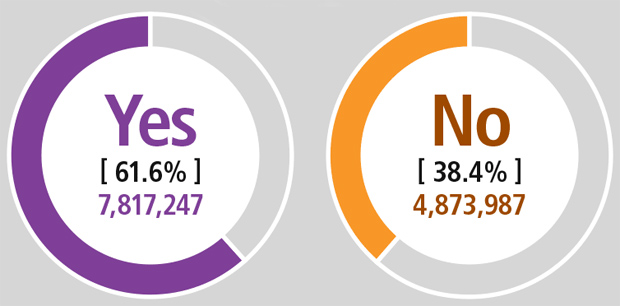
The Australian Bureau of Statistics has finished its counting and the results are in … a majority of Australians in all States favour a change in the law to allow same-sex couples to marry.
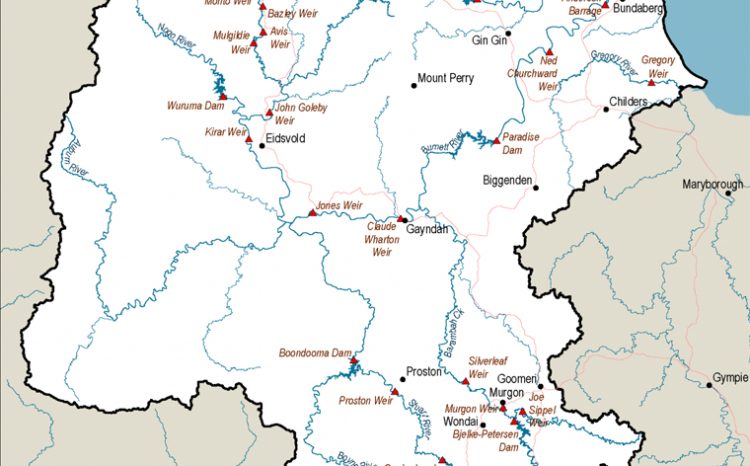
In the South Burnett, two of our three local Federal seats supported the change, while Maranoa – as polls predicted – voted “no”.
It was one of 17 electorates across Australia to record a majority “no” response.
In Maranoa (which includes the southern sections of the South Burnett including Kingaroy and Nanango), only 43.9 per cent of voters ticked “yes” (35,475 votes), while 56.1 per cent voted “no” (80,783); 78.2 per cent of eligible voters returned their survey forms.
In Flynn (which covers a central strip of the region including Wondai), 51.5 per cent voted “yes” (39,020) and 48.5 per cent voted “no” (75,803); there was a 75.6 per cent response rate.
In Wide Bay (which includes Murgon, Cherbourg and Goomeri), 55.6 per cent voted “yes” (46,507) and 44.4 per cent voted “no” (37,065); the response rate was 79.5 per cent.
However, these three conservative seats in Queensland – all held by the LNP – look quite radical when compared with some Labor electorates in NSW:
The Labor seat of Blaxland in NSW, a working class electorate in Sydney’s western suburbs formerly held by ex-Prime Minister Paul Keating, recorded the highest “no” vote in Australia, 73.9 per cent.
Nearby Werriwa, also a Labor stronghold and formerly held by ex-Prime Minister Gough Whitlam, voted 63.7 per cent “no”; and Watson, another Labor Sydney electorate, voted “no” by 69.6 per cent.
In fact, 12 of the 17 electorates across Australia that voted “no” are all located in western Sydney.
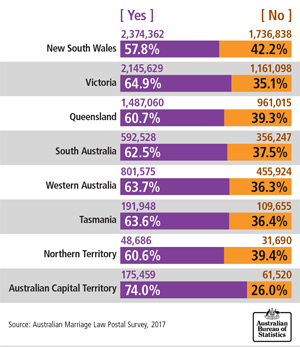
But overall, all States voted in favour of same-sex marriage.
In Queensland, 60.7 per cent of people who voted (1,487,060 votes) ticked “yes”, while 39.3 per cent (961,015) said “no”.
The State with the highest percentage of “yes” voters was the ACT, with 74 per cent (175,459).
Ironically, NSW – the State that is home to the annual Gay and Lesbian Mardi Gras – had the highest percentage of “no” votes: 42.2 per cent (1,736,838).
Participation rates in the non-compulsory survey varied across Australia but overall 79.5 per cent of eligible Australians returned a form (nearly eight out of 10 people).
The lowest returns were in the Northern Territory (58.4 per cent) and the highest in the ACT (82.4 per cent).
In Queensland, 2,455,163 (77.9 per cent) of eligible Australians took part.
According to the ABS, women were more likely to respond than males.
In Queensland, 80.1 per cent (1,286,719) of eligible women and 75.6 per cent (1,149,465) of eligible men responded to the survey.
Also in Queensland, people aged 70 to 74 were the most likely to respond to the survey, with 89.6 per cent of eligible Queenslanders in this age group participating.
The participation rate was lowest in those aged 20 to 24 at 67.6 per cent.
