April 14, 2016
by Dafyd Martindale
In 2014, southburnett.com.au carried out a detailed study which compared South Burnett rates with other Queensland councils
The results of this first study surprised many because they showed that – while none of us like to pay rates – back in 2013-14 the South Burnett was mid-range compared with our neighbours.
And outside the densely populated south-east corner, we were also cheaper than most places with a water view.
The data for our study was taken from standardised, State-wide rates and charges data collected from Queensland councils every year by the Department of Local Government.
To see how our region stacked up, we first compared the South Burnett with our five neighbours (Somerset, Toowoomba, Western Downs, North Burnett and Gympie regional councils) which have similar geography and face similar problems.
Then we compared our rates with the rates paid by Queenslanders living in 10 regions along the coast, as this is where most of the State’s population lives.
And finally, we compared our rates against four of Queensland’s biggest metropolitan councils – Brisbane, Ipswich, Moreton and the Sunshine Coast – to see how we stacked up against the biggest councils in the State.
Last year, we repeated the study with 2014-15 data.
And when the Department of Local Government made the 2015-16 data available on March 23 this year, we decided to do the study a third time.
Here’s what we found:
* * *
How The South Burnett Compares With Its Neighbours
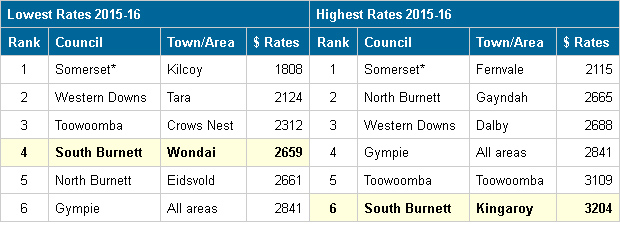
In last year’s study we found that when compared with our immediate neighbours, the South Burnett’s rates were neither the cheapest nor the most expensive on offer – we were about mid-range.
However, those rankings have deteriorated over the past 12 months.
While Wondai (at the lower end) retained last year’s position, at the higher end Kingaroy’s average residential rates bill of $3204 pushed it into the top spot; Kingaroy residents are now paying $95 more a year than if they lived in Toowoomba City.
The South Burnett’s drop in the neighbourhood rankings last year was largely due to the introduction of the annual $200 Road Levy.
The SBRC brought in the levy after it unexpectedly lost $1.4 million a year in road funding in 2012.
That funding still hasn’t been restored so the Road Levy remains in place.
This is a burden none of our neighbours share except Gympie, which calls its own $110 annual levy a “Roads Infrastructure Charge”.
* * *
How The South Burnett Compares With Coastal Shires
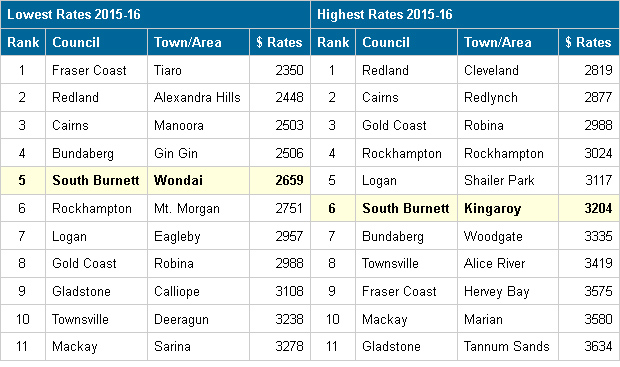
In last year’s comparison with coastal shires, we found the South Burnett was cheaper – at both the lower and higher ends – than almost any place on the coast outside the four major metropolitan councils.
That position has changed over the last year, with the South Burnett slipping from near top of the table down to the middle.
The reason for this deterioration is that over the past 12 months some coastal councils reduced their rates (in the case of Gold Coast, quite significantly) while ours increased.
* * *
How The South Burnett Compares With Metropolitan Areas
In 2013-14, our cheapest residential rates (for Wondai) turned out to be the second cheapest on offer when compared with four of the largest metropolitan councils.
Last year, that ranking slipped from 2 to 4.
And this year it slipped to 5 (at both the low and high ends), which means that all South Burnett residents pay more rates than they would if they lived in Brisbane, Moreton, the Sunshine Coast or Ipswich.
A major reason for this – apart from the Road Levy – is that these Councils have much bigger populations to share costs.
Brisbane has a population of more than 1.1 million; Moreton 408,000; Sunshine Coast 330,000; and Ipswich 183,000.
But the South Burnett has just 32,600 residents, and only 18,000-odd ratepayers spread over 8200sq km with a 3200km road network to maintain.
Little wonder the big metropolitan regions can whip us, and probably always will.
* * *
So How Do We Really Stack Up?
The introduction of the Road Levy in the 2013-14 Budget moved all our annual rate bills $200 higher, and it’s stayed that way for the past three years.
The SBRC said it had no choice in the matter.
To prevent our road network falling to pieces, it either had to bring in the Road Levy or start closing pools, libraries, halls and other civic amenities.
To judge by the recent local government elections, it seems most of us now accept that while no one likes the Road Levy, we’re stuck with it until the Federal Government restores adequate road funding or another revenue source can be found.
Our road network is simply too important to all of us to be allowed to fall into decay.
Even so, our annual studies have shown that in the past three years average residential rates in Wondai have risen from $1920 to $2659, while rates in Kingaroy have climbed from $2443 to $3204.
This is an increase of between 32 per cent and 38 per cent in just 36 months.
And even if the Road Levy disappeared tomorrow, it would still be an increase of 22 to 28 per cent.
There are, of course, reasons for this increase.
One of them is that the Local Government CPI has been increasing at rate higher than the 2.5 per cent or less CPI the rest of us live with.
This increase has been fuelled in part by the State and Federal Governments shifting some of their responsibilities onto local government without paying the true cost of doing the work.
Another factor is that in the last few years the South Burnett Regional Council has chosen to take an aggressive approach to fixing our region’s ageing infrastructure.
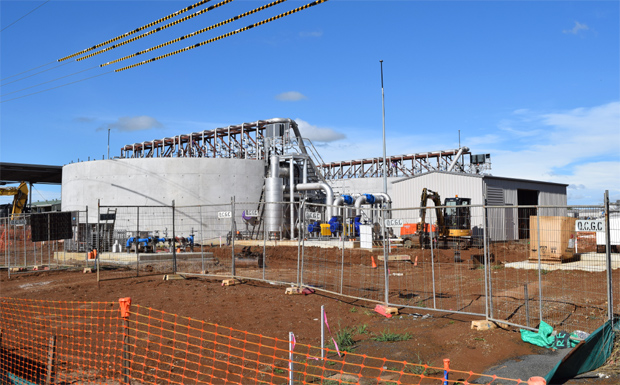
This includes the new Kingaroy Waste Water Treatment plant, the Gordonbrook and Murgon water treatment plants, Blackbutt’s long-standing drainage issues and our region’s bridge replacement program.
Tackling all of these things has required literally tens of millions of dollars.
Some of this has been funded by grants, some by borrowings, and the balance – it would seem – through ratepayer contributions.
But when these projects are completed, demand for revenue should ease.
And our rankings in the rates tables, which have been dropping the last three years, may turn around when this occurs.
We’ll let you know … in about 12 months from now.
* * *
Notes On Comparisons With Neighbouring Councils::
- This table directly compares the lowest and highest average residential rates levied by each of the five councils the South Burnett shares borders with using data supplied by LG Information.
- For the purpose of fair and equal comparison, the total figure shown for each Council is the Total Average Rates & Charges Per Annum figure supplied by LG Information before any rates discount is applied, since rates discounts vary from nil to 15 per cent in different shires.
- This table does not include the Cherbourg Aboriginal Shire Council because that council does not collect rates.
Notes On Comparison With Other Regional Councils:
- This table directly compares the lowest and highest average residential rates levied by eight other Queensland regional councils, along with Logan and Redland in the Brisbane metropolitan area, using data supplied by LG Information.
- These councils were chosen because all of them supply the same mix of services (ie water, sewerage, waste collection) that the South Burnett Regional Council supplies
- For the purpose of fair and equal comparison, the total figure shown for each Council is the Total Average Rates & Charges Per Annum figure supplied by LG Information before any rates discount is applied.
Notes On Comparison With Metropolitan Councils:
- Residents in metropolitan councils like Brisbane, Ipswich, Moreton, the Sunshine Coast and Somerset now have their water and sewerage services supplied by State-owned corporations Unitywater or Queensland Urban Utilities.
- These corporations bill residents quarterly for these services, which no longer appear on council rate notices.
- Because of this, the figures shown in this table comprise the rates levied by each of these five councils (shown in the Department Of Local Government’s figures) plus the annual access charges levied by Unitywater or Queensland Urban Utilities (as shown on their websites)
External links:
- LG Information – 2015-16 Residential Rating introduction and Residential Rating, and 2014-15 Residential Rating (Excel spreadsheet)
- Queensland Urban Utilities (Brisbane, Ipswich, Somerset)
- Unitywater (Moreton, Sunshine Coast)
Related articles:
- Rates: How Do We Compare This Year? (2014-15 comparison)
- Rates: How Do We Compare? (2013-14 comparison)
Note: Councils which have an asterisk (*) next to their names are those where water and sewerage access charges are levied separately by utility companies; these charges have been added on to the rates levied by those councils to arrive at a fair comparison with the South Burnett, where water and sewerage access charges are included in rates bills



















I wonder with the mine company now aggressively pursuing the purchase of landholdings for the new mine will our rates decrease the same as our land values will?