March 20, 2015
by Dafyd Martindale
Last July southburnett.com.au carried out the first study undertaken in this region to see how our rates really compared with other Queensland councils.
The results surprised many because they showed that while none of us like to pay rates, we could all be paying a lot more if we chose to live elsewhere.
The data for our study was taken from standardised, State-wide information collected every year by the Department of Local Government.
To get a good view of how our region stacked up, we first compared the South Burnett with the five regions we share borders with (Somerset, Toowoomba, Western Downs, North Burnett and Gympie Regional Councils).
Then we compared our rates with the rates paid by Queenslanders living in 10 regions along the Queensland coast, since the coast is where most of the State’s population lives.
And finally, we compared our rates against four of Queensland’s biggest metropolitan councils.
When we undertook this study, the most recent data available was for the 2012-2013 financial year.
But today the Department made 2013-2014 data available, so we have done the study again.
Here’s what we found:
* * *
How The South Burnett Compares with Our Neighbours
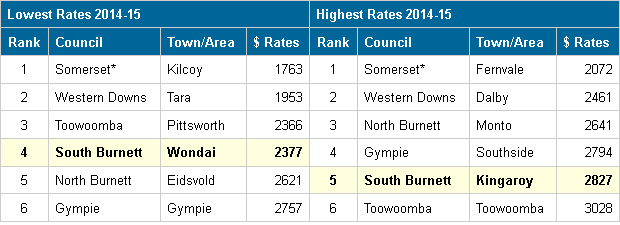
In last year’s study we found that when compared with our immediate neighbours, the South Burnett’s rates were neither the cheapest nor the most expensive on offer.
Our cheapest residential area (Wondai) was rated 3 of 6, and our most expensive (Kingaroy) was 4 of 6
This put us at about mid-range.
However those rankings have deteriorated over the past 12 months.
Wondai now ranks 4 of 6 after being beaten out of third place by Pittsworth, which was $11 a year cheaper in 2013-14.
And Kingaroy has been pushed into fifth position by Gympie’s Southside area, which was $33 a year cheaper.
The South Burnett’s fall in the rankings in 2013-14 was due to the introduction of the $200-per-property Road Levy in the 2013-14 Budget.
The SBRC brought in the levy after it unexpectedly lost $1.4 million a year in road funding in 2012.
That funding still hasn’t been restored, and the Road Levy remains in place.
Had the SBRC not introduced the Road Levy, then our region would have the third least expensive residential rates amongst all our neighbours at both the low and high ends of the range.
But our road network would probably be falling to pieces, too.
* * *
How The South Burnett Compares With Coastal Shires
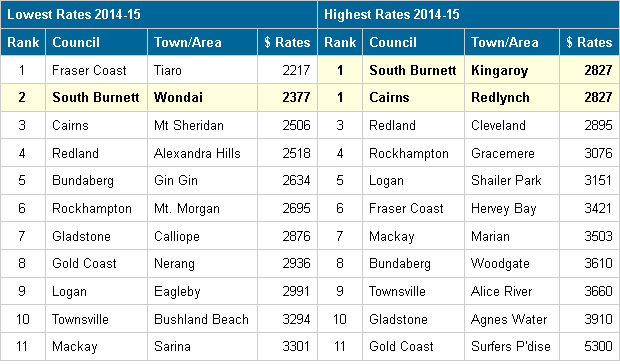
In last year’s comparison with coastal shires, we found the South Burnett was cheaper – at both the lower and higher ends – than almost any place with a water view.
That position has not changed significantly over the last year, although Kingaroy now shares a joint Number 1 ranking with the Cairns suburb of Redlynch.
* * *
How The South Burnett Compares With Metropolitan Areas
Last year, our cheapest residential rates (for Wondai) turned out to be the second cheapest on offer when compared with four of the largest metropolitan councils.
This year, that ranking has slipped from 2 to 4.
And at the high end (Kingaroy) our ranking remains unchanged: Kingaroy residents pay more rates than they would if they lived in Brisbane, Moreton, the Sunshine Coast or Ipswich.
A big part of the reason for this difference – apart from the Road Levy – is that these Councils have much bigger populations to share costs amongst.
Brisbane has a population of more than 1 million; Moreton 406,000; Sunshine Coast 251,000; and Ipswich 180,000.
The South Burnett has just 33,000 residents, and only 18,000-odd ratepayers.
* * *
So How Do We Really Stack Up?
The introduction of the Road Levy in the 2013-14 Budget moved all our annual rate bills $200 higher.
The SBRC said it had no choice in the matter.
On the one hand, it is obligated to provide basic services to residents, and trafficable roads are part of those basic services. On the other, it is also obliged by law to return a balanced budget.
The sudden withdrawal of $1.4 million a year in government road funding in 2012 put the Council in a bind, and the Road Levy was its answer until adequate road funding is restored.
The alternative was to shut down swimming pools, libraries, halls and other public amenities the Council runs, as well as put some Council road workers on the dole queue.
But are our rates excessive in comparison to other areas?
The evidence says no, they’re not.
Right now we pay an average of between $45 and $54 a week in rates for a residential block in the region, plus water and sewage usage charges.
If we packed up and moved to Somerset (our cheapest neighbour) we’d pay $33 to $39 a week. And if we went to Western Downs, $37 to $47 – again, with usage charges on top.
But in Toowoomba we’d pay $45 to $58 per week; $50 a week anywhere in the North Burnett; and $53 per week anywhere in Gympie.
While it’s true current rates are a struggle – particularly for those on fixed incomes – they’re still better than the average $54 to $75 a week which now prevails on most of the coast (we’ll ignore the $100 a week it costs in Surfer’s Paradise).
These charges are also not that far off the $40 to $46 a week that prevails in big metropolitan areas.
This tends to reinforce Queensland Treasury’s assessment this week that the SBRC is being competently managed.
In seven years it’s moved from the fiscal mess it inherited when it was formed (Murgon bankrupt; Wondai and Nanango not far off it; and only Kingaroy rated as reasonable) to a position where the entire region is now sustainable.
And if the government ever restores the road funding it took from us, we’ll be in an even better position.
Note: We do not expect the results of this year’s study to alter much over the coming year. In its 2014-15 Budget, the South Burnett Regional Council introduced a CPI rate increase of 2.75 per cent. But so did almost all our neighbours.
* * *
Notes On Comparisons With Neighbouring Councils::
- This table directly compares the lowest and highest average residential rates levied by each of the five councils the South Burnett shares borders with using data supplied by LG Information.
- For the purpose of fair and equal comparison, the total figure shown for each Council is the Total Average Rates & Charges Per Annum figure supplied by LG Information before any rates discount is applied, since rates discounts vary from nil to 15 per cent in different shires.
- This table does not include the Cherbourg Aboriginal Shire Council because that council does not collect rates.
Notes On Comparison With Other Regional Councils:
- This table directly compares the lowest and highest average residential rates levied by eight other Queensland regional councils, along with Logan and Redland in the Brisbane metropolitan area, using data supplied by LG Information.
- These councils were chosen because all of them supply the same mix of services (ie water, sewerage, waste collection) that the South Burnett Regional Council supplies
- For the purpose of fair and equal comparison, the total figure shown for each Council is the Total Average Rates & Charges Per Annum figure supplied by LG Information before any rates discount is applied.
Notes On Comparison With Metropolitan Councils:
- Residents in metropolitan councils like Brisbane, Ipswich, Moreton and the Sunshine Coast now have their water and sewerage services supplied by State-owned corporations Unitywater or Queensland Urban Utilities.
- These corporations bill residents quarterly for these services, which no longer appear on council rate notices.
- Because of this, the figures shown in this table comprise the rates levied by each of these five councils (shown in the Department Of Local Government’s figures) plus the annual access charges levied by Unitywater or Queensland Urban Utilities (as shown on their websites)
External links:
- LG Information– 2014-15 Residential Rating introduction, 2014-15 Residential Rating and 2013-14 Residential Rating (Excel spreadsheet)
- Queensland Urban Utilities
- Unitywater
Related articles:
- Rates: How Do We Compare? (last year’s study)
- Council Finances Get Thumbs Up
