March 20, 2017
by Dafyd Martindale
In 2014, southburnett.com.au carried out a detailed study which compared South Burnett rates with other Queensland councils
The results of this study – the first carried out in our region – surprised many because they showed that while none of us like to pay rates, the South Burnett compared fairly well with neighbouring regions.
And outside the densely populated south-east corner where most of Queensland’s population live, our rates were also cheaper than most coastal areas where the majority of the State’s remaining population lives.
The information for our study was taken from standardised, State-wide rates and charges data collected by the Department of Local Government from Queensland councils every year.
To see how our region stacked up, we first compared the South Burnett with our five neighbours (Somerset, Toowoomba, Western Downs, North Burnett and Gympie regional councils) which have similar geography and face similar problems.
Then we compared our rates against the rates paid by Queenslanders living in 10 regions along the coast.
And finally, we compared our rates against four of Queensland’s biggest metropolitan councils – Brisbane, Ipswich, Moreton and the Sunshine Coast – to see how we stacked up against the largest councils in the State.
We carried out this identical study in each of the three succeeding years.
And when the Department of Local Government made the 2016-17 data available this week, we decided to do the study a fourth time.
Here’s what we found this year:
* * *
How The South Burnett Compares With Our Neighbours
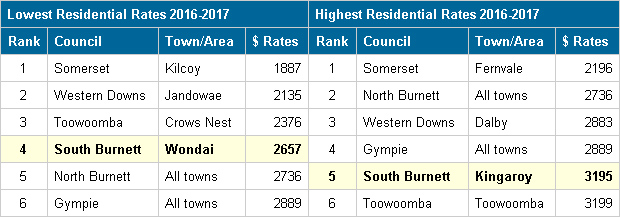
In last year’s study we found that when compared with our immediate neighbours, the South Burnett’s rates were neither the cheapest nor the most expensive on offer … we were about mid-range.
However, those rankings have slightly improved over the past 12 months.
While Wondai (at the lower end) retained last year’s fourth position, at the higher end Kingaroy’s average residential rates bill of $3195 pushed it back up to 5th place; Kingaroy residents are now paying $4 a year less than if they lived in Toowoomba City.
The South Burnett’s current position is largely due to the annual $200 road levy, which the Council was forced to bring in when it lost $1.4 million in annual road funding in 2012.
That funding still hasn’t been restored so the road levy remains in place.
This is a burden none of our neighbours share except Gympie, which calls its own $110 annual levy a “Roads Infrastructure Charge”.
Removal of that levy – if it ever happens – would quickly bump us up into the middle tier.
* * *
How The South Burnett Compares With Coastal Shires
In last year’s comparison with coastal shires, we found the South Burnett had slipped from near top of the table down to the middle.
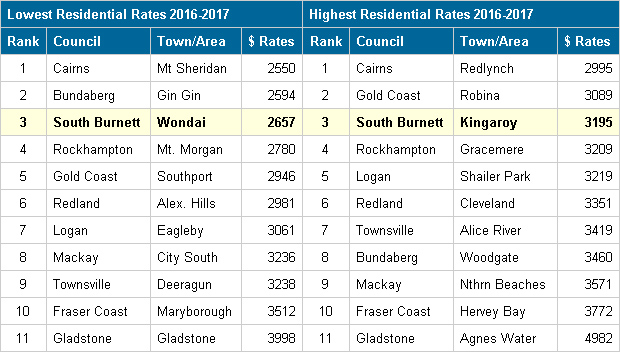
But this year we rose back up to hold third position at both the lower and upper ends – or in other words, we are cheaper than most rural coastal regions in the State.
At the lower end, the South Burnett came in third place against Mt Sheridan (Cairns Regional Council) and Gin Gin (Bundaberg Regional Council), who pipped us by up to $107 a year, or about $2 a week.
And at the upper end, Redlynch and Robina were as much as $200 a year cheaper than Kingaroy’s average residential rates, or about $4 a week.
But everywhere else on the coast cost more (in Gladstone’s case, a lot more) than the South Burnett.
* * *
How The South Burnett Compares With Metropolitan Areas
Finally, it’s probably no surprise to anyone that the South Burnett’s rates are more expensive than the large metropolitan councils of south-east Queensland.
They have much bigger populations to help spread the cost, and most have much smaller road networks to maintain as well.
But the surprise this year was that at the lower end, the South Burnett’s cheapest rates beat those of Ipswich, pushing us back into fourth place.
And at the higher end, the difference between Ipswich and the South Burnett was just $500 a year, even though Ipswich has almost seven times the population and just one-seventh of the land area we do.
* * *
So How Do We Really Stack Up?
The introduction of the Road Levy in the 2013-14 Budget moved all our annual rate bills $200 higher, and it’s stayed that way for the past four years.
The SBRC said it had no choice.
To prevent our road network falling to pieces, it either had to bring in the Road Levy or start closing pools, libraries, halls and other amenities.
Our road network was simply too important to all of us to be allowed to fall into decay.
The Road Levy also figured in last year’s local government elections, with some candidates promising to scrap it if elected.
But to judge by that election’s results, it seems most of us accept that while no one likes the levy, we’re stuck with it until the Federal Government restores our fair share of road funding or some other revenue source can be found.
One point worth noting, though, is that in our last study we reported that in the previous three years average residential rates in Wondai had risen from $1920 to $2659, while rates in Kingaroy had climbed from $2443 to $3204.
This was equivalent to an increase of between 32 per cent and 38 per cent in just 36 months.
But this year average residential rates have marginally declined (Wondai $2657, Kingaroy $3195).
So what’s happened?
Well, it seems the tight fiscal management policies the South Burnett Regional Council has been pursuing since amalgamation are finally starting to show dividends.
That, plus four years of population growth at a little over one percent, has led to a small turnaround.
And after three years of slipping in the rates tables, it’s nice to see this year’s small bounce-backs.
We can only hope this continues into the future.
And we’ll let you know how it all pans out for 2017-18 … in about 12 months from now.
* * *
Notes On Comparisons With Neighbouring Councils::
- This table directly compares the lowest and highest average residential rates levied by each of the five councils the South Burnett shares borders with using data supplied by LG Information.
- For the purpose of fair and equal comparison, the total figure shown for each Council is the Total Average Rates & Charges Per Annum figure supplied by LG Information before any rates discount is applied, since rates discounts vary from nil to 15 per cent in different shires.
- This table does not include the Cherbourg Aboriginal Shire Council because that council does not collect rates.
- Somerset Council’s water and sewerage charges are billed separately by Queensland Urban Utilities and do not appear on that Council’s rates notices, so the average water and sewerage charges for Kilcoy and Fernvale have been added to Somerset Council’s rates data to provide an accurate comparison.
Notes On Comparison With Other Regional Councils:
- This table directly compares the lowest and highest average residential rates levied by eight other Queensland regional councils, along with Logan and Redland in the Brisbane metropolitan area, using data supplied by LG Information.
- These councils were chosen because all of them supply the same mix of services (ie water, sewerage, waste collection) that the South Burnett Regional Council supplies.
- For the purpose of fair and equal comparison, the total figure shown for each Council is the Total Average Rates & Charges Per Annum figure supplied by LG Information before any rates discount is applied.
Notes On Comparison With Metropolitan Councils:
- Residents in metropolitan councils like Brisbane, Ipswich, Moreton, the Sunshine Coast and Somerset now have their water and sewerage services supplied by State-owned corporations Unitywater or Queensland Urban Utilities.
- These corporations bill residents quarterly for these services, which no longer appear on council rate notices.
- Because of this, the figures shown in this table comprise the rates levied by each of these five councils (shown in the Department Of Local Government’s figures) plus the annual access charges levied by Unitywater or Queensland Urban Utilities (as shown on their websites)
External links:
- LG Information – 2016-17 Residential Rating introduction and Residential Rating, and 2015-16 Residential Rating (Excel spreadsheet)
- Queensland Urban Utilities (Brisbane, Ipswich, Somerset)
- Unitywater (Moreton, Sunshine Coast)
Related articles:
- Rates: How Do We Compare In 2016? (2015-16 comparison)
- Rates: How Do We Compare This Year? (2014-15 comparison)
- Rates: How Do We Compare? (2013-14 comparison)












How is that when you do your ranking sheet, the lowest section ranks from low to high meaning the lowest $ is ranked 1 the lowest figure, yet when you do the highest ranking you you still have the lowest $ ranked 1 eg: you have Kingaroy ranked 5 , when it should be 1 as the highest. You cant have the highest ranked rate $ at no 5
Pete: when councils submit their rates data to the Department Of Local Government, those councils which have uniform rates often only submit one figure (eg: Brisbane City Council, which charges the same rates whether you live in St Lucia or Newstead). But other councils which have rates that vary (eg: Toowoomba, South Burnett) submit a range from lowest to highest.
This being so, we rank the lowest Toowoomba rate (eg: Crows Nest) against the lowest South Burnett rate (eg: Wondai) to find out where we fit at the low end; and then we do the same with highest against highest, for all the councils in our survey. Which means we do the calculations – and rankings – twice, which produces the variations in rank position you’re talking about.
We’re the first to admit there is a drawback to this methodology, and it is that a council may have just 10 per cent (say) of ratepayers at the low end and 90 per cent at the high end. Just look at Western Downs, where Jandowae residents pay $2135 but Dalby residents pay $2883. We’re fairly sure there are probably more people paying the higher rate in Western Downs than the lower rate.
And we’re the first to agree it would be much better if all councils just submitted one average residential rate for their shire, because that would nix this possibility.
But they don’t at the present time, so we use this method because we think it provides the fairest direct comparison: like with like. However, if you can think of a better way to do it we’re always open to new ideas.
As the $ decide the ranking, irrespective of how those $ are made up. My point is how can the highest $ figure in your “highest residential rate” ranking sheet not be “ranked” number 1? Rankings are just that, lowest to highest or highest to lowest. eg: Sports people could be “ranked” on $ or points earned and if you earned (using your metropolitan area ranking sheet as a guide) $3195 or points, compared to someone who earned $2371 or points, that person would be “ranked” number 1, not number 5, it appears at a quick glance at the bold figures that the SB is ranked 5th highest, it’s THE highest ranked
Pete: It’s true that many ranking tables rank from highest to lowest – for example, Richest People In The World or Best Paid Sportsperson. This is logical, because they’re measuring from most successful to least successful.
In the case of our rates comparison, though, we measure from lowest rates to highest rates because most ratepayers generally regard low rates as a sign of their council’s success, and high rates as a sign of failure.
OMG! What sort of a joke a you trying to play here! We have nothing in the way of services compared to Brisbane. Acacia Ridge $1000 per annum vs Kingaroy $3200 per annum. They have bigger, wider, thicker roads and some of the best services in the state, arguably the country.
Kingaroy GOMA, I concede, probably draws some of the region’s funds down. I think the biggest cash vacuum however is the dinosaur exhibit that is SBRC. It would be nice to see some young blood with innovative ideas, at least an attempt to turn the Kingaroy ghost town situation around. Work with state and federal departments to reduce the costs of living to people outside the metropolitan areas. These rates are a great way to stop growth in the region.
Maybe the councillors are spending it on walking frames and false teeth glue?
Daniel, two things:
If you examine a rates notice for Acacia Ridge, it will not include water and sewerage charges. This is because in Brisbane and other parts of SEQ (including the Sunshine Coast) these are levied by separate utility companies. Our study adds in average water and sewerage charges in areas serviced by utility companies to arrive at a fair comparison between the South Burnett and metropolitan councils.
Second, rates roughly reflect the cost of running a city, shire or region divided by the number of residents they contain. The City of Brisbane has a population of 1.16 million, covers an area of 1367 sq.km. and has a population density of 850 people per sq.km. By contrast, the South Burnett has a population of about 33,500; covers an area of 8399 sq.km. and has a population density of less than 4 people per sq.km.
This disparity in area and population density is the reason why Brisbane appears to have better facilities and roads (eg: they have 850 people to pay for the upkeep of one kilometre of road; we have just four people). A fairer comparison is to look at how we compare with our immediate neighbours – particularly Gympie and Western Downs – which have similar populations and similar road networks to maintain.