July 27, 2014
by Dafyd Martindale
At southburnett.com.au we hear a lot of claims about the South Burnett’s rates. There’s no doubt people aren’t happy paying the road levy. And a councillor only has to receive a 1 cent pay rise for the predictable whingeing to begin.
Let’s face it. No one likes paying rates. And over the past few years, rates have been going up (thank you Federal and State Governments for transferring responsibilities to local governments while reducing funding at the same time).
Everyone would also like rates to go down.
But how does the South Burnett REALLY stack up against other councils in Queensland?
Are we being ripped off? Or should we stop thinking the grass is always greener somewhere else?
* * *
Figures produced by the Queensland Department of Local Government show that in 2013-14, the South Burnett Regional Council’s rates were actually among the lowest in Queensland for the level of services the council provides.
The information quoted below comes from the department’s LG Information Service, which collects data from all Queensland councils each year to produce State-wide Council statistics.
We used this public data to run the South Burnett up against other regional councils in order to see how our region compares.
And while the Department warns that direct comparisons may not be entirely fair, given that individual councils face different local circumstances, we think the results are worth examining.
Note: We prepared this comparison with no assistance from the South Burnett Regional Council.
* * *
South Burnett Rates Compared With Neighbouring Councils
For each shire, LG Information provides information for the local government area’s lowest and highest general rates (listed per town/area).
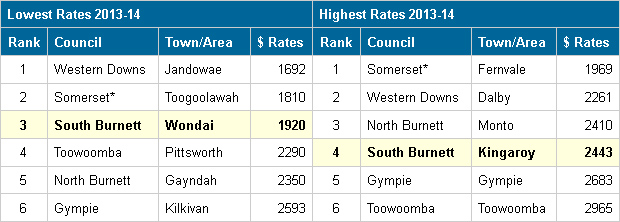
In a comparison of the South Burnett with the five neighbouring councils who share its borders (Somerset, Toowoomba, Western Downs, North Burnett and Gympie), the South Burnett’s rates are mid-range.
The South Burnett’s lowest rates listed (at Wondai) are just $397 a year higher than the cheapest on offer ($1523 at Jandowae in the Western Downs) and a full $522 a year lower than the most expensive ($2965 per year in Toowoomba).
Surprisingly, the South Burnett’s most expensive rates ($2443 a year in Kingaroy) are still $150 a year cheaper than those levied by Gympie Regional Council in Kilkivan ($2593).
* * *
South Burnett Rates Compared With Other Regional Councils
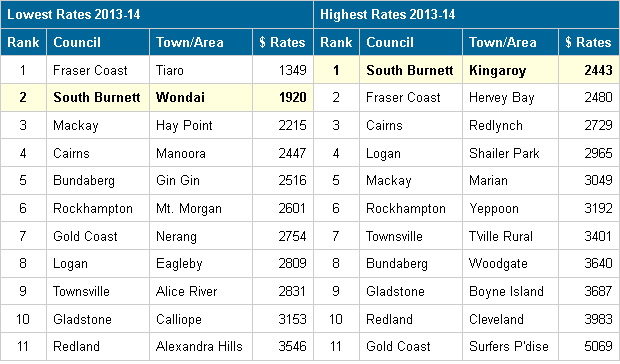
A comparison of the South Burnett’s rates with 10 other regional councils spread from the Gold Coast to Cairns shows they’re now among the lowest in regional Queensland, too.
In general, the South Burnett’s lowest rates are cheaper than those faced by almost all residents in coastal cities.
They’re also lower than those levied on Logan and Redland residents on the fringes of the Brisbane metropolitan area.
And when it comes to the South Burnett’s highest rates (in Kingaroy), they’re the cheapest of all.
* * *
South Burnett Rates Compared With Metropolitan Councils
Finally, the South Burnett’s rates also stack up well against densely populated metropolitan areas where costs – and public facilities such as swimming pools and libraries – are shared among a much larger population base.
It costs Wondai residents just $5 a year more to live in the South Burnett than if they lived in Deception Bay. Wondai’s rates are also cheaper than Brisbane, the Sunshine Coast or Ipswich.
And while Kingaroy’s rates are definitely higher than all metropolitan areas, they’re not all that much higher given the big disparity in population (Brisbane has a population of more than 1 million; Moreton 406,000; Sunshine Coast 251,000; and Ipswich 180,000. The South Burnett has around 33,000 residents, and only 18,000-odd ratepayers).
* * *
As noted before, we prepared this comparison on 2013-14 rates. The South Burnett Regional Council handed down its 2014-15 Budget on Friday. So this year, South Burnett ratepayers will face:
- A minimum general rate of $632
- A minimum sewerage charge of $530
- A waste collection charge of $145
- Minimum water access charges of $445, and
- Additional charges – including the $200 road levy – of $335
This adds up to an average annual rates bill of $2097 for town residents who receive all services, and somewhat less for rural ratepayers who don’t.
All other Councils we have checked also have had 2014-15 general rates rises of a similar percentage as the South Burnett, so we believe the comparisons in this report are still valid.
* * *
Notes On Comparisons With Neighbouring Councils::
- This table directly compares the lowest and highest average rates levied by each of the five councils the South Burnett shares borders with using data supplied by LG Information.
- For the purpose of fair and equal comparison, the total figure shown for each Council is the Total Average Rates & Charges Per Annum figure supplied by LG Information before any rates discount is applied, since rates discounts vary from nil to 15 per cent in different shires.
- This table does not include the Cherbourg Aboriginal Shire Council because that council does not collect rates.
Notes On Comparison With Other Regional Councils:
- This table directly compares the lowest and highest average rates levied by eight other Queensland regional councils, along with Logan and Redland in the Brisbane metropolitan area, using data supplied by LG Information.
- These councils were chosen because all of them supply the same mix of services (ie water, sewerage, waste collection) that the South Burnett Regional Council supplies
- For the purpose of fair and equal comparison, the total figure shown for each Council is the Total Average Rates & Charges Per Annum figure supplied by LG Information before any rates discount is applied.
Notes On Comparison With Metropolitan Councils:
- Residents in metropolitan councils like Brisbane, Ipswich, Moreton and the Sunshine Coast now have their water and sewerage services supplied by State-owned corporations Unitywater or Queensland Urban Utilities.
- These corporations bill residents quarterly for these services, which no longer appear on council rate notices.
- Because of this, the figures shown in this table comprise the rates levied by each of these five councils (shown in the Department Of Local Government’s figures) plus the annual access charges levied by Unitywater or Queensland Urban Utilities (as shown on their websites)
External links:
- LG Information– 2013-14 Residential Rating introduction, 2013-14 Residential Rating and 2012-13 Residential Rating (Excel spreadsheet)
- Queensland Urban Utilities
- Unitywater
